Chapter 13 Statistics and Probability
Class 10th Maths NCERT Exemplar Solution
NCERT Exemplar Problems Class 10 Maths Solutions Chapter 13 Statistics and Probability
Exercise 13.1 Multiple Choice Questions (MCQs)
Question
1: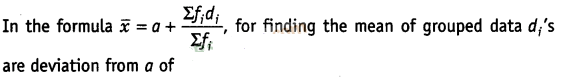
(a) lower limits of the
classes
(b) upper limits of the classes
(c) mid-points of the
classes
(d) frequencies of the class marks
Solution:
(c)
We know that, \({d}_{i}\) = \({ x }_{ i }\) – a
i.e., \({d}_{i}\)‘s are
the deviation from a of mid-points of the classes.
Question
2:
While computing mean of grouped data, we assume that the
frequencies are
(a) evenly distributed over all the classes
(b) centred at
the class marks of the classes
(c) centred at the upper limits of the
classes
(d) centred at the lower limits of the classes
Solution:
(b)
In computing the mean of grouped data, the frequencies are centred at the class
marks of the classes.
Question
3:
(a)
0
(b)
-1
(c)
1
(d) 2
Solution: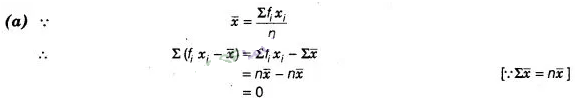
Question
4: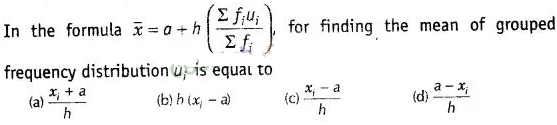
Solution:
Question
5:
The abscissa of the point of intersection of the less than
type and of the more than type cumulative frequency curves of a grouped data
gives its
(a)
mean
(b)
median
(c)
mode
(d) All of these
Solution:
(b) Since,
the intersection point of less than ogive and more than ogive gives the median
on the abscissa.
Question
6:
For the following distribution,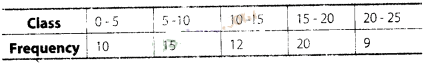
the sum of lower limits
of the median class and modal class is
(a)
15
(b)
25
(c)
30
(d) 35
Solution: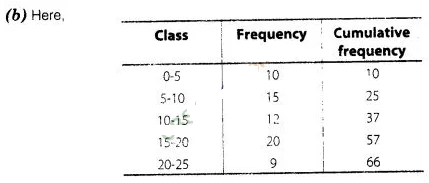
Now,\(\frac{N}{2}
=\frac{66}{2}\)= 33, which lies in the interval 10-15. Therefore, lower limit of
the median class is
10.
. ,
The highest frequency is
20, which lies in the interval 15-20. Therefore, lower limit of modal class is
15. Hence, required sum is 10 + 15 = 25.
Question
7:
Consider the following frequency distribution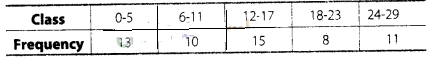
The upper limit of the
median class is
(a)
7
(b)
17.5
(c)
18
(d) 18.5
Solution:
Question
8:
For the following distribution,
the modal class is
(a)
10-20
(b) 20-30 (c)
30-40
(d) 30-40
Solution:
Here,we see that
the highest frequency is 30. which lies in the interval 30-40.
Question
9:
consider the data.
The difference of the
upper limit of the median class and the lower limit of the modal class is
(a)
0
(b)
19
(c)
20
(d) 38
Solution: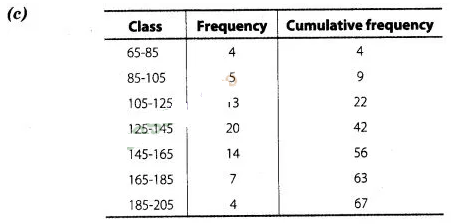
Here,\(\frac{N}{2}
=\frac{67}{2}\) = 33.5 which lies in the interval 125 -145.
Hence, upper
limit of median class is 145.
Here, we see that the highest frequency is 20
which lies in 125-145. Hence, the lower limit of modal class is 125.
Required
difference = Upper limit of median class – Lower limit of modal class
=
145-125 = 20
Question
10:
The times (in seconds) taken by 150 atheletes to run a
110 m hurdle race are tabulated below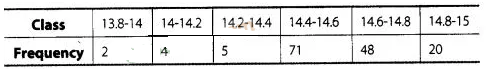
The number of atheletes
who completed the race in less than 14.6 s is
(a)
11
(b)
71
(c)
82
(d) 130
Solution:
(c)
The number of atheletes who completed the race in less than 14.6
= 2 + 4+
5+71 =82
Question
11:
Consider the following distribution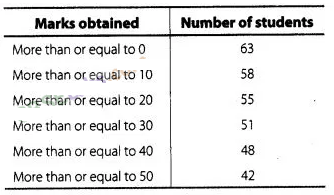
the frequency of the
class 30-40 is
(a)
3
(b)
4
(c)
3
(d) 4
Solution: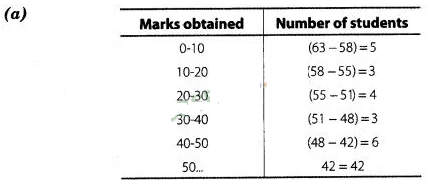
Hence,frequency in the
class interval 30-40 is 3
Question
12:
If an event cannot occur, then its probability is
(a)
1
(b)
\(\frac{3}{4}\)
(c) \(\frac{1}{2}\)
(d) 0
Solution:
(d) The event which cannot occur
is said to be impossible event and probability of impossible event is zero.
Question
13:
Which of the following cannot be the probability of an
event?
(a) \(\frac{1}{2}\)
(b)
0.1
(c)
3
(d) \(\frac{17}{16}\)
Solution:
(d)
Since, probability of an event always lies between 0 and 1.
Question
14:
An event is very unlikely to happen. Its probability is
closest to
(a)
0.0001
(b)
0.001
(c)
0.01
(d) 0.1
Solution:
(a)
The probability of an event which is very unlikely to happen is closest to zero
and from the given options 0.0001 is closest to zero.
Question
15:
If the probability of an event is P, then the probability
of its completmentry event will be
(a) P
-1
(b)
P
(c) 1 –
P
(d) 1 — \(\frac{1}{P}\)
Solution:
(c)
Since, probability of an event + probability of its complementry event = 1
So, probability of its complementry event = 1 – Probability of an event = 1 –
P
Question
16:
The probability expressed as a percentage of a particular
occurrence can never be
(a) less than
100
(b) less than 0
(c) greater than
1
(d) anything but a whole number
Solution:
(b)
We know that, the probability expressed as a percentage always lie between 0 and
100. So, it cannot be less than 0.
Question
17:
If P (A) denotes the probability of an event A, then
(a) P(A) <
0
(b) P(A) >
1
(c) 0 ≤ P(A) ≤
1
(d) -1 ≤ P(A) ≤ 1
Solution:
(c)
Since, probability of an event always lies between 0 and 1.
Question
18:
If a card is selected from a deck of 52 cards, then the
probability of its being a red face card is
(a) \(\frac{3}{26}\)
(b) \(\frac{3}{13}\)
(c) \(\frac{2}{13}\)
(d) \(\frac{1}{2}\)
Solution:
(c) In a
deck of 52 cards, there are 12 face cards i.e.,6 red and 6 black cards.
So,
probability of getting a red face card = \(\frac{6}{52}
=\frac{3}{26}\)
Question
19:
The probability that a non-leap your selected at random
will contains 53 Sunday
is
‘
(a) \(\frac{1}{7}\)
(b) \(\frac{2}{7}\)
(c) \(\frac{3}{7}\)
(d) \(\frac{5}{7}\)
Solution:
(a)
A non-leap year has 365 days and therefore 52 weeks and 1 day. This 1 day may be
Sunday or Monday or Tuesday or Wednesday or Thursday or Friday or Saturday.
Thus, out of 7 possibilities, 1 favourable event is the event that the one day
is Sunday.
∴ Required probability = \(\frac{1}{7}\)
Question
20:
When a die is thrown, the probability of getting an odd
number less than 3 is ,
(a) \(\frac{1}{6}\)
(b) \(\frac{1}{3}\)
(c) \(\frac{1}{2}\)
(d) 0
Solution:
(a) When a die-is thrown,then
total number of outcomes = 6 Odd number less than 3 is 1 only.
Number of
possible outcomes = 1
Required probability = \(\frac{1}{6}\)
Question
21:
A card is drawn from a deck of 52 cards. The event E is
that card is not an ace of hearts. The number of outcomes favourable to E is
(a)
4
(b)
13
(c)
48
(d) 51
Solution:
(d)
In a deck of 52 cards, there are 13 cards of heart and 1 is ace of heart.
Hence, the number of outcomes favourable to E = 51
Question
22:
The probability of getting a bad egg in a lot of 400 is
0.035. The number of bad eggs in the lot is
(a)
7
(b)
14
(c)
21
(d) 28
Solution:
(b)
Here,
total number of eggs = 400
Probability of getting a bad egg = 0.035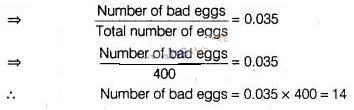
Question
23:
A girl calculates that the probability of her winning the
first prize in a lottery is 0.08. If 6000 tickets are sold, then how many
tickets has she bought?
(a)
40
(b)
240
(c)
480
(d) 750
Solution:
(c) Given,
total number of sold tickets = 6000
Let she bought x tickets.
Hence, she bought 480
tickets.
Question
24:
One ticket is drawn at random from a bag containing
tickets numbered 1 to 40. The probability that the selected ticket has a number
which is a multiple of 5 is
(a) \(\frac{1}{5}\)
(b) \(\frac{3}{5}\)
(c) \(\frac{4}{5}\)
(d) \(\frac{1}{3}\)
Solution:
(a)
Number of total outcomes = 40
Multiples of 5 between 1 to 40 = 5,10,15,20,25.
30 35, 40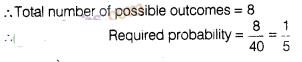
Question
25:
Someone is asked to take a number from 1 to 100. The
probability that it is a prime,is
(a) \(\frac{1}{5}\)
(b) \(\frac{6}{25}\)
(c) \(\frac{1}{4}\)
(d) \(\frac{13}{50}\)
Solution:
(c)
Total numbers of outcomes = 100
So, the prime numbers between 1 to 100 are 2,
3, 5, 7,11,13,17,19, 23, 29, 31,37, 41. 43, 47, 53, 56, 61, 67, 71, 73, 79, 83,
89 and 97.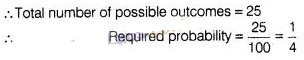
Question
26:
A school has five houses A, B, C, D and E. A class has 23
students, 4 from house A, 8 from house B, 5 from house C, 2 from house D and
rest from house E. A single student is selected at random to be the class
monitor. The probability that the selected student is not from A, B and C is
(a) \(\frac{4}{23}\)
(b) \(\frac{6}{23}\)
(c) \(\frac{8}{23}\)
(d) \(\frac{17}{23}\)
Solution:
(b)
Total number of students = 23
Number of students in house A, B and C = 4+ 8 +
5 = 17
Exercise 13.2 Very Short Answer Type Questions
Question
1:
The median of an ungrouped data and the median calculated
when the same data is grouped are always the same. Do you think that this is a
correct statement? Give reason.
Solution:
Not always,
because for calculating median of a grouped data, the formula used is based on
the assumption that the observations in the classes are uniformal distributed
(or equally spaced).
Question
2:
In calculating the mean of grouped data, grouped in
classes of equal width, we may use the formula,
Where, a is the assumed
mean, a must be one of the mid-point of the classes. Is the last statement
correct? Justify your answer.
Solution:
No, it is
not necessary that assumed mean consider as the mid-point of the class interval.
It is considered as any value which is easy to simplify it.
Question
3:
Is it true to say that the mean, mode and median of
grouped data will always be different? Justify your answer
Solution:
the value of these three measures can be the same, it depends on the type of
data.
Question
4:
Will the median class and modal class of grouped data
always be different? Justify your answer.
Solution:
Not
always, It depends on the given data.
Question
5:
In a family having three children, there may be no girl,
one girl, two girls or three girls. So, the probability of each is
\(\frac{1}{4}\) . Is this correct? Justify your answer.
Solution:
No,
the probability of each is not \(\frac{1}{4}\) because the probability of no
girl in three children is zero and probability of three girls in three children
is one.
Justification
So, these events are not equally
likely as outcome one girl, means gbb, bgb, bbg ‘three girls’ means ‘ggg’ and so
on.
Question
6:
A game consists of spinning an arrow which comes to rest
pointing at one of the regions (1, 2 or 3) (see figure). Are the outcomes 1, 2
and 3 equally likely to occur? Give reasons
Solution:
No,
the outcomes are not equally likely, because 3 contains half part of the
total region, so it is more likely than 1 and 2, since 1 and 2, each contains
half part of the remaining part of the region.
Question
7:
Apoorv throws two dice once and computes the product of
the numbers appearing on the dice. Peehu throws one die and squares the number
that appears on it. Who has the better chance of getting the number 36?
Why?
Solution:
Apoorv
throws two dice once.
So total number of outcomes = 36
Number of outcomes
for getting product 36 = 1 (6 x 6)
Hence, Peehu has better
chance of getting the number 36.
Question
8:
When we toss a coin, there are two possible outcomes-head
or tail. Therefore, the probability of each outcome is \(\frac{1}{2}\). Justify
your answer
Solution:
Yes,
probability of each outcome is \(\frac{1}{2}\) because head and tail both are
equally likely events.
Question
9:
A student says that, if you throw a die, it will show up 1
or not 1. Therefore, the probability of getting 1 and the probability of getting
not 1. each is equal to \(\frac{1}{2}\). Is this correct? Give reasons.
Solution:
No, this is
not correct.
Suppose we throw a die, then total number of outcomes = 6
Possible outcomes = 1 or 2 or 3 or 4 or 5 or 6
Question
10:
I toss three coins together. The possible outcomes are no
heads, 1 head,2 head and 3 heads. So, I say that probability of no heads is
\(\frac{1}{4}\). What is wrong with this conclusion?
Solution:
I
toss three coins
together
[given]
So, total number of outcomes = 23 = 8
and possible
outcomes are (HHH), (HTT), (THT), (TTH),(HHT), (THH), (HIH)and (TTT)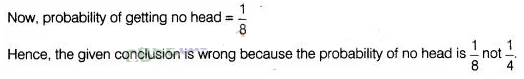
Question
11:
If you toss a coin 6 times and it comes down heads on
each occasion. Can you say that the probability of getting a head is 1? Given
reasons.
Solution:
No. if let
we toss a coin, then we get head or tail, both are equally likely events
So,probability is \(\frac{1}{2}\). If we toss a coin 6 times, then probability
will be same in each case. So, the 2
probability of getting a head is not
1.
Question
12:
Sushma tosses a coin 3 times and gets tail each time. Do
you think that the outcome of next toss will be a tail? Give reasons.
Solution:
The outcome
of next toss may or may not be tail, because on tossing a coin, we get head or
tail so both are equally likely events.
Question
13:
If I toss a coin 3 times and get head each time, should I
expect a tail to have a higher chance in the 4th toss? Give reason in support of
your answer.
Solution:
No, let we
toss a coin, then we get head or tail, both are equaly likely events i.e.,
probability of each event is \(\frac{1}{2}\). So, no question of expecting a
tail to have a higher chance in 4th toss.
Question
14:
A bag contains slips numbered from 1 to 100. If Fatima
chooses a slip at random from the bag, it will either be an odd number or an
even number. Since, this situation has only two possible outcomes, so the 1
probability of each is \(\frac{1}{2}\). Justify.
Solution:
We
know that, between 1 to 100 half numbers are even and half numbers are odd i.e.,
50 numbers (2, 4, 6, 8…. 96, 98,100) are even and 50 numbers (1,3, 5, 7. . , 97,
99) are odd.
So, both events are equally likely.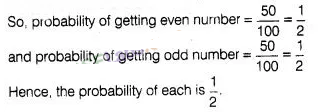
Exercise
13.3 Short Answer Type Questions
Question
1:
Find the mean of the distribution
Solution:
We first, find the class mark xi, of each class and then proceed as
follows.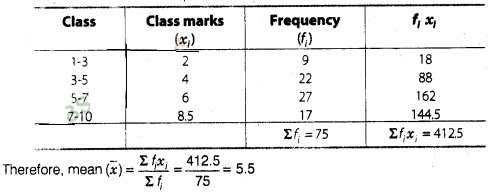
Hence, mean of the
given distribution is 5.5.
Question
2:
Calculate the mean of the scores of 20 students in a
mathematics test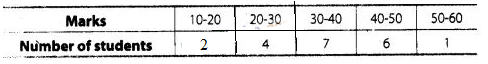
Solution:
We first, find the class mark of each class and then proceed as follows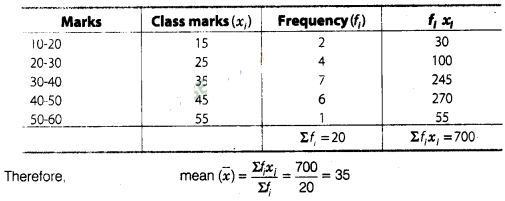
Hence, the mean of
scores of 20 students in mathematics test is 35.
Question
3:
Calculate the mean of the following data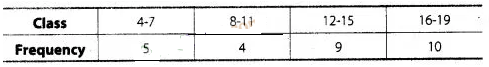
Solution:
Since, given data is not continuous, so we subtract 0.5 from the lower limit and
add 0.5 in the upper limit of each class.
Now, we first find the class
mark xi, of each class and then proceed as follows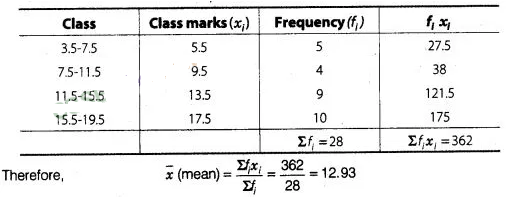
Hence, mean of the
given data is 12.93.
Question
4:
The following table gives the number of pages written by
Sarika for completing her own book for 30 days.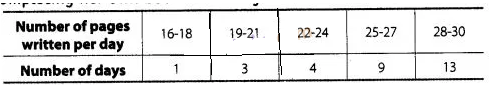
Find the mean number of
pages written per day.
Solution:
Since,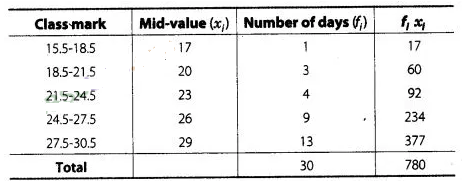
Since, given data is
not continuous, so we subtract 0.5 from the lower limit and add 0.5 in the upper
limit of each class.![]()
Hence, the mean of
pages written per day is 26.
Question
5:
The daily income of a sample of 50 employees are tabulated
as follows.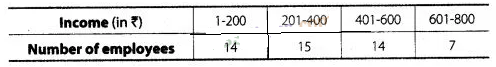
Find the mean daily
income of employees.
Solution:
Since, given
data is not continuous, so we subtract 0.5 from the lower limit and add 0.5 in
the upper limit of each class.
Now we first, find the class
mark xi, of each class and then proceed as follows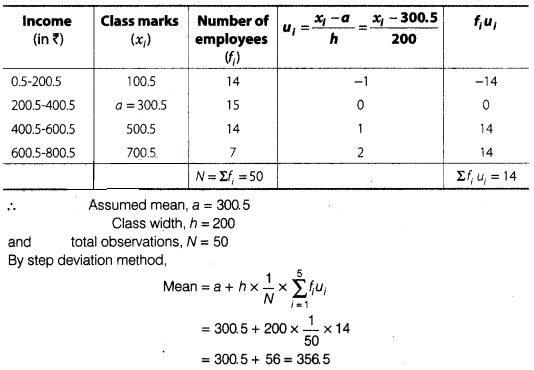
Question
6:
An aircraft has 120 passenger seats. The number of seats
occupied during 100 flights is given in the following table.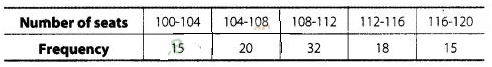
Determine the mean
number of seats occupied over the flights.
Solution:
We
first, find the class mark xi, of each class and then proceed as
follows.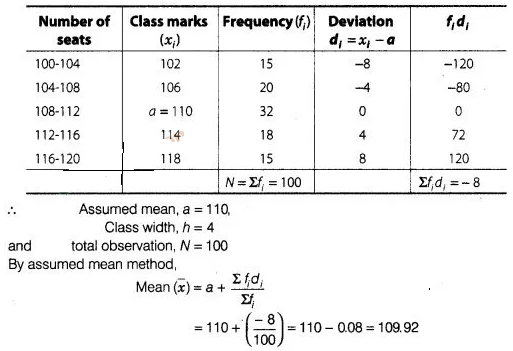
Question
7:
The weights (in kg) of 50 wrestlers are recorded in the
following table.
Find the mean weight of the wrestlers.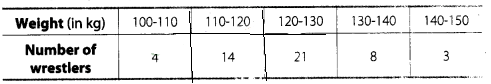
Solution:
We first find the class mark of each class and then proceed as follows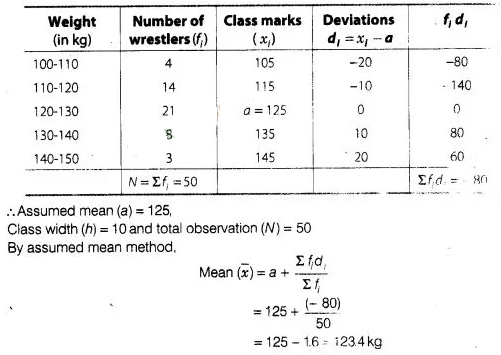
Question
8:
The mileage (km per litre) of 50 cars of the same model
was tested by a manufacturer and details are tabulated as given below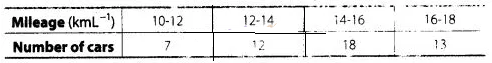
Find the mean
mileage.
The manufacturer claimed that the mileage of the model was 16 kmL
-1.
Do you agree with this claim?
Solution: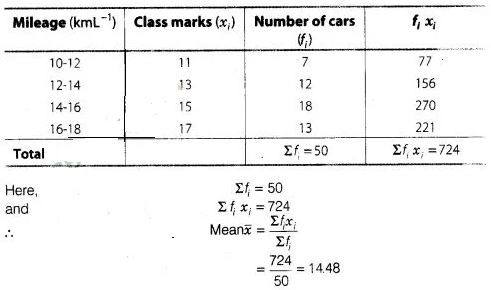
Hence, mean mileage is
14.48 kmL-1.
No, the manufacturer is claiming mileage 1.52
kmh-1 more than average mileage.
Question
9:
The following is the distribution of weights (in kg) of 40
persons.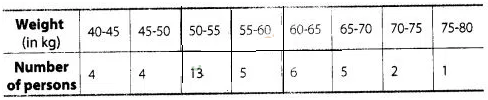
Construct a cumulative
frequency distribution (of the less than type) table for the data
above.
Solution:
The
cumulative distribution (less than type) table is shown below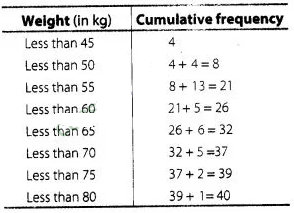
Question
10:
The following table shows the cumulative frequency
distribution of marks of 800 students in an examination.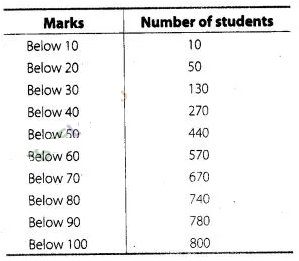
Construct a frequency
distribution table for the data above.
Solution:
Here,
we observe that 10 students have scored marks below 10 i.e., it lies between
class interval 0-10. Similarly, 50 students have scored marks below 20. So, 50
-10 = 40 students lies in the interval 10-20 and so on. The table of a frequency
distribution for the given data is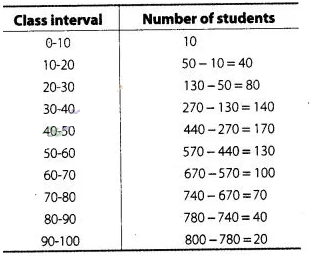
Question
11:
From the frequency distribution table from the following
data.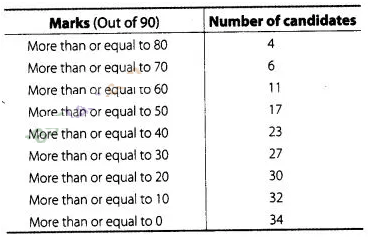
Solution:
Here,
we observe that, all 34 students have scored marks more than or equal to 0.
Since, 32 students have scored marks more than or equal to 10. So, 34- 32 =2
students lies in the interval 0-10 and so on.
Now, we construct the frequency
distribution table.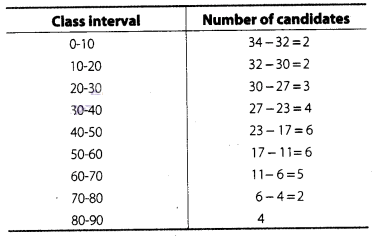
Question
12:
Find the unknown entries o, b, c, d, e and f in the
following distribution of heights of students in a class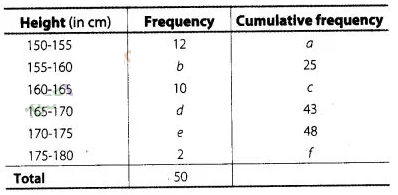
Solution: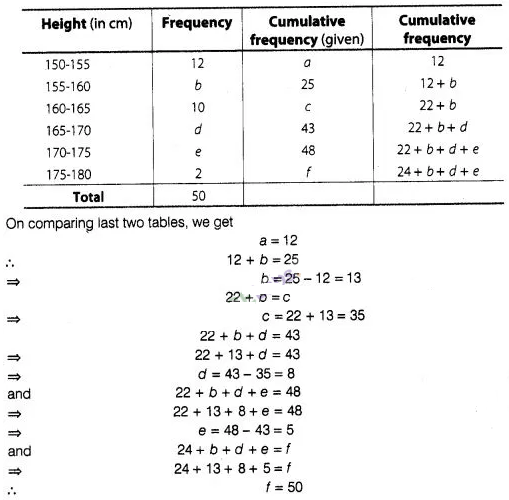
Question
13:
The following are the ages of 300 patients getting
medical treatment in a hospital on a particular day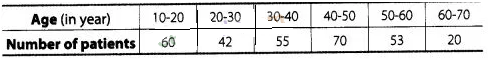
Form
(i) less than
type cumulative frequency distribution.
(ii) More than type cumulative
frequency distribution.
Solution:
(i) We
observe that the number of patients which take medical treatment in a hospital
on a particular day less than 10 is O’. Similarly, less than 20 include the
number of patients which take medical treatment from 0-10 as well as the number
of patients which take medical treatment from 10-20.
So, the total number of
patients less than 20 is 0 + 60 = 60, we say that the cumulative frequency of
the class 10-20 is 60. Similarly, for other class.
(ii) Also, we observe that
all 300 patients which take medical treatment more than or equal to 10. Since,
there are 60 patients which take medical treatment in the interval 10-20, this
means that there are 300 – 60 = 240 patients which take medical treatment more
than or equal to 20. Continuing in the same manner.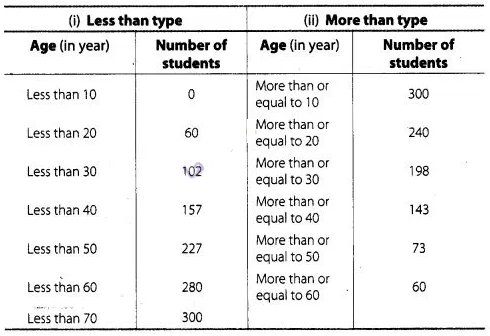
Question
14:
Given below is a cumulative frequency distribution
showing the marks secured by 50 students of a class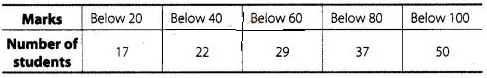
Form the frequency
distribution table for the data.
Solution:
Here, we
observe that, 17 students have scored marks below 20 i.e., it lies between class
interval 0-20 and 22 students have scored marks below 40, so 22 -17 = 5 students
lies in the class interval 20-40 continuing in the same manner, we get the
complete frequency distribution table for given data.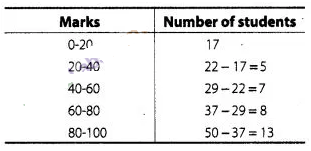
Question
15:
Weekly income of 600 families is tabulated below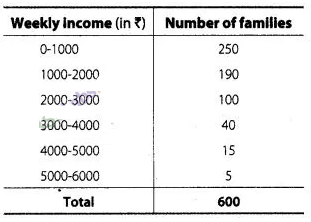
Compute the median
income.
Solution:
First we
construct a cumulative frequency table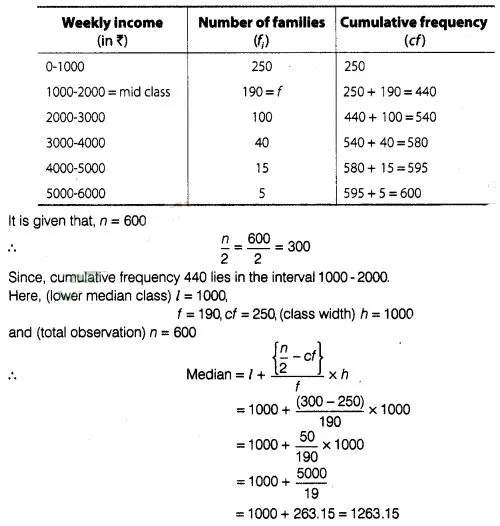
Hence, the median
income is ₹ 1263.15.
Question
16:
The maximum bowling speeds, in km per hour, of 33 players
at a cricket coaching centre are given as follows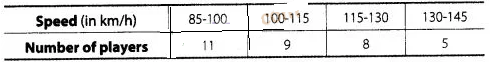
Caluculate the median
bowling speed.
Solution:
First we
construct the cumulative frequency table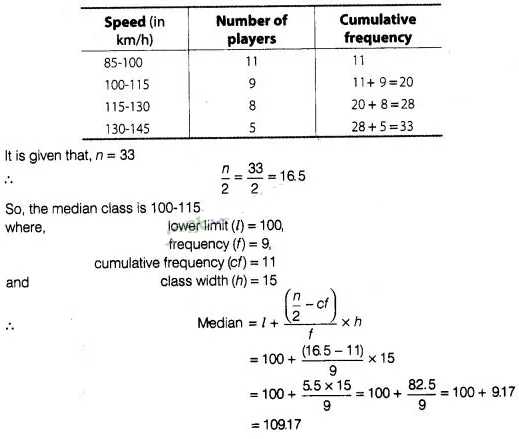
Hence, the median
bowling speed is 109.17 km/h.
Question
17:
The monthly income of 100 families are given as
below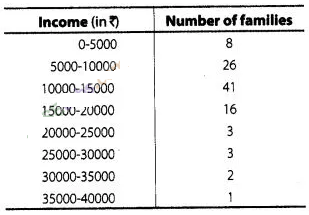
Caluculate the model
income.
Solution:
In a given
data, the highest frequency is 41, which lies in the interval
10000-15000.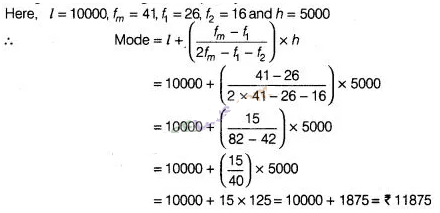
Hence, the modal income
is ₹ 11875.
Question
18:
The weight of coffee in 70 packets are shown in the
following table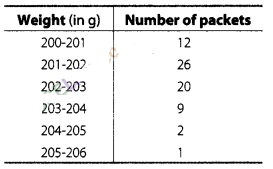
Determine the model
weight .
Solution:
In the given
data, the highest frequency is 26, which lies in the interval 201-202
Hence, the modal weight
is 201.7 g.
Question
19:
Two dice are thrown at the same time. Find the
probability of getting
(i) same number on both dice.
(ii) different
number on both dice.
Solution:
Two dice are
thrown at the same
time.
[given]
So, total number of possible outcomes = 36
(i) We have, same
number on both dice.
So, possible outcomes are (1,1), (2, 2), (3, 3), (4, 4),
(5, 5) and (6, 6).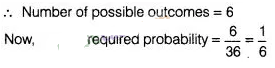
(ii) We have, different
number on both dice.
So, number of possible outcomes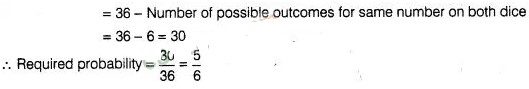
Question
20:
Two dice are thrown simultaneously. What is the
probability that the sum of the numbers appearing on the dice is
(i) 7
?
(ii) a prime number
?
(iii) 1 ?
Solution:
Two dice are
thrown
simultaneously.
[given]
So, total number of possible outcomes = 36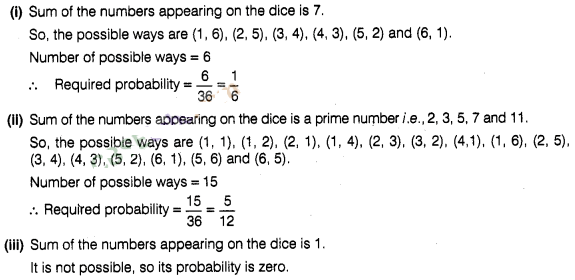
Question
21:
Two dice are thrown together. Find the probability that
the product of the numbers on the top of the dice is
(i)
6
(ii)
12
(iii) 7
Solution:
Number of
total outcomes = 36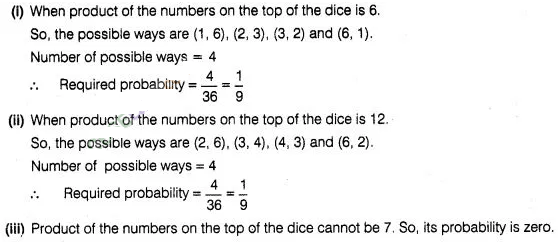
Question
22:
Two dice are thrown at the same time and the product of
numbers appearing on them is noted. Find the probability that the product is
less than 9.
Solution:
Number of
total outcomes = 36
When product of numbers appearing on them is less than 9,
then possible ways are (1,6), (1,5) (1,4), (1,3), (1,2), (1,1), (2, 2), (2, 3),
(2, 4), (3, 2), (4, 2), (4,1), (3,1), (5,1), (6,1) and (2,1).
Number of
possible ways = 16
Required probability = \(\frac{16}{36} =
\frac{4}{9}\)
Question
23:
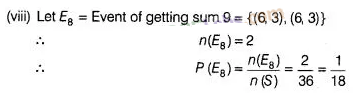
Two dice are numbered 1, 2, 3, 4, 5, 6 and 1, 1, 2, 2, 3,
3, respectively. They are thrown and the sum of the numbers on them is noted.
Find the probability of getting each sum from 2 to 9, separately.
Solution:
Number of
total outcomes = 36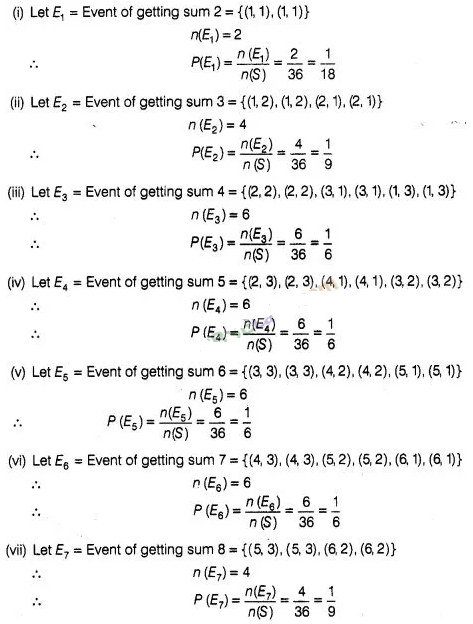
Question
24:
A coin is tossed two times. Find the probability of
getting atmost one head.
Solution:
The possible
outcomes,if a coin is tossed 2 times is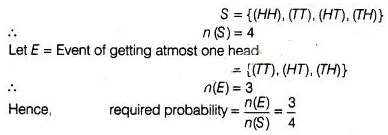
Question
25:
A coin is tossed 3 times. List the possible outcomes.
Find the probability of getting
(i) all
heads
(ii) atleast 2 heads
Solution:
The possible
outcomes if a coin is tossed 3 times is
S = {(HHH), (TTT), (HTT), (THT),
(TEH), (THH), (HTH), (HHT)}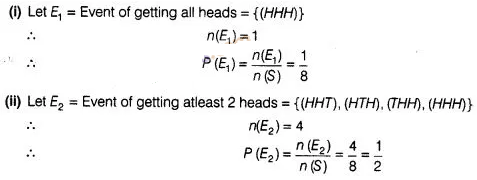
Question
26:
Two dice are thrown at the same time. Determine the
probability that the difference of the numbers on the two dice is 2.
Solution:
The total
number of sample space in two dice, n (S) = 6 x 6 = 36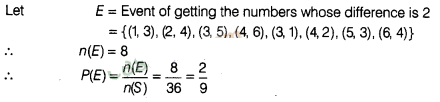
Question
27:
A bag contains 10 red, 5 blue and 7 green balls. A ball
is drawn at random. Find the probability of this ball being a
(i) red
ball
(ii) green
ball
(iii) not a blue ball
solution:
if a ball
is drawn out of 22 balls (5 blue + 7 green + 10 red), then the total number of
outcomes are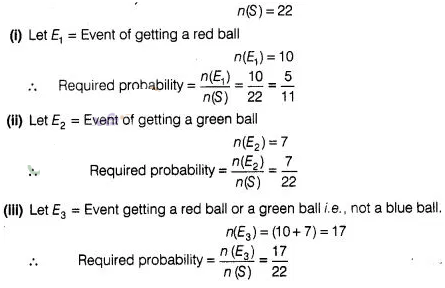
Question
28:
The king, queen and jack of clubs are removed from a deck
of 52 playing cards and then well shuffled. Now, one card is drawn at fandom
from the remaining cards. Determine the probability that the card is
(i) a
heart
(ii) a king
Solution:
If we remove
one king, one queen and one jack of clubs from 52 cards, then the remaining
cards left, n(S) = 49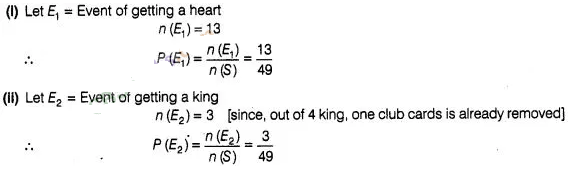
Question
29:
Refer to Q.28. What is the probability that the card
is
(i) a
club
(ii) 10 of hearts
Solution: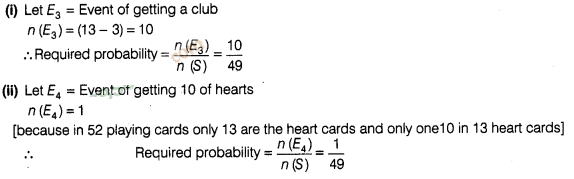
Question
30:
All the jacks, queensapd kings are removed from a deck of
52 playing cards. The remaining cards are well shuffled and then one card is
drawn at random. Giving ace a value 1 similar value for other cards, find the
probability that the card has a value.
(i)
7
(ii) greater than
7
(iii) Less than
7
Solution:
In out of 52
playing cards, 4 jacks, 4 queens and 4 kings are removed, then the remaining
cards are left, n(S) = 52 – 3 x 4 = 40.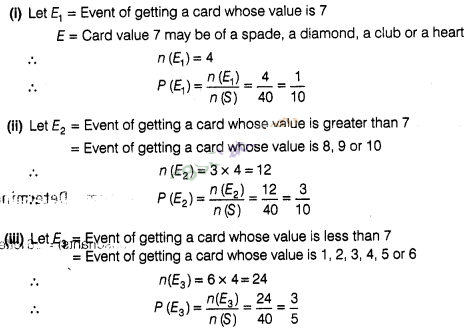
Question
31:
An integer is chosen between 0 and 100. What is the
probability that it is
(i) divisible by
7?
(ii) not divisible by 7?
Solution:
The number
of integers between 0 and 100 is
n(S)= 99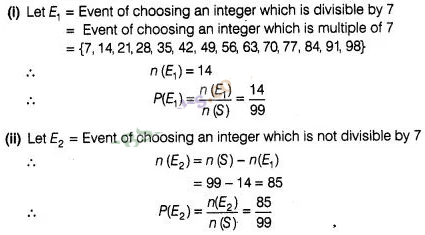
Question
32:
Cards with numbers 2 to 101 are placed in a box. A card
is selected at random. Find the probability that the card has
(i) an even
number
(ii) a square
number
‘
Solution:
Total number
of out comes with numbers 2 to 101, n(s) =100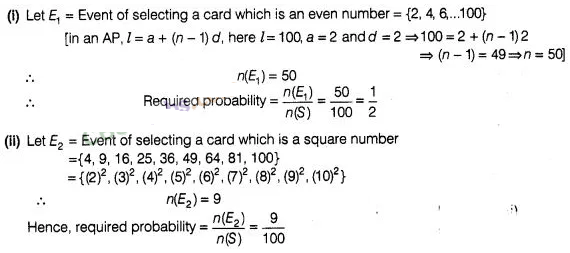
Question
33:
A letter of english alphabets is chosen at random.
Determine the probability that the letter is a consonant
Solution:
We
know that, in english alphabets, there are (5 vowels + 21 consonants)=26
letters. So,
total number of outcomes in english alphabets
are,
n(S) = 26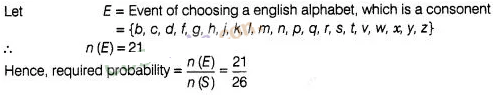
Question
34:
There are 1000 sealed envelopes in a box, 10 of them
contain a cash prize of ₹ 100 each, 100 of them contain a cash prize of
₹ 50 each and 200 of them contain a cash prize of ₹ 10 each and rest
do not contain any cash prize. If they are well shuffled and an envelope is
picked up out, what is the probability that it contains no cash prize?
Solution:
Total number
of sealed envelopes in a box, n (S) = 1000
Number of envelopes containing
cash prize = 10 + 100 + 200 = 310
Number of envelopes containing no cash
prize,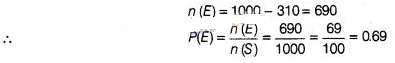
Question
35:
Box A contains 25 slips of which 19 are marked ₹ 1
and other are marked ₹ 5 each. Box B contains 50 slips of which 45 are
marked ₹ 1 each and others are marked ₹ 13 each. Slips of both boxes
are poured into a third box and resuffled. A slip is drawn at random. What is
the probability that it is marked other than ₹ 1?
Solution:
Total number of slips in a box, n(S) = 25 + 50 = 75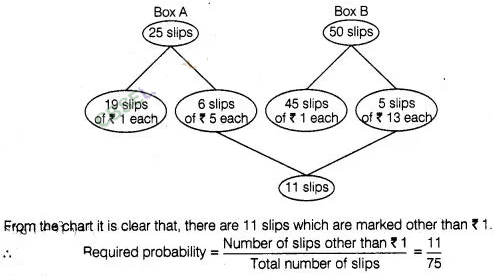
Question
36:
A carton of 24 bulbs contain 6 defective bulbs. One bulb
is drawn at random. What is the probability that the bulb is not defective? If
the bulb selected is defective and it is not replaced and a second bulb is
selected at random from the rest, what is the probability that the second bulb
is defective?
Solution:
∴Total
number of bulbs, n (S) = 24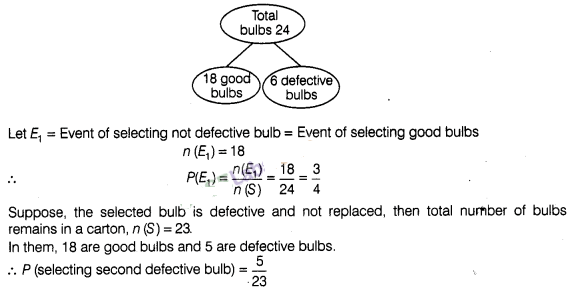
Question
37:
A child’s game has 8 triangles of which 3 are blue and
rest are red, and 10 squares of which 6 are blue and rest are red. One piece is
lost at random. Find the probability that it is a
(i)
triangle
(ii)
square
(iii)square of blue
colour
(iv) triangle of red colour
Solution: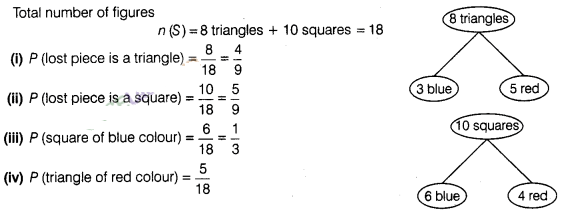
Question
38:
In a game, the entry fee is of ₹ 5. The game
consists of a tossing a coin 3 times. If one or two heads show, Sweta gets her
entry fee back. If she throws 3 heads, she receives double the entry fees.
Otherwise she will lose. For tossing a coin three times, find the probability
that she
(i) loses the entry fee.
(ii) gets double entry
fee.
(iii) just gets her entry fee.
Solution:
Total
possible outcomes of tossing a coin 3 times,
S = {(HHH), (TTT), (HTT), (THT),
(TTH), (THH), (HTH), (HHT)}
∴
n (S) = 8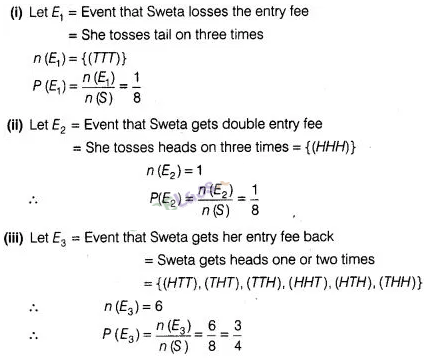
Question
39:
A die has its six faces marked 0, 1, 1, 1, 6, 6. Two such
dice are thrown together and the total score is recorded.
(i) How many
different scores are possible?
(ii) What is the probability of getting a
total of 7?
Solution:
Given, a die
has its six faces marked {0,1,1,1,6, 6}
Total sample space, n(S) =
62 = 36
(i) The different score which are possible are 6 scores
e., 0,1,2,6,7 and12.
(ii) Let E = Event of getting a sum 7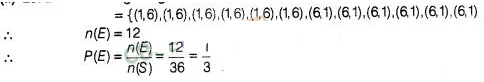
Question
40:
A lot consists of 48 mobile phones of which 42 are good,
3 have only minor defects and 3 have major defects. Varnika will buy a phone, if
it is good but the trader will only buy a mobile, if it has no major defect. One
phone is selected at random from the lot. What is the probability that it is
(i) acceptable to Varnika?
(ii) acceptable to the trader?
Solution: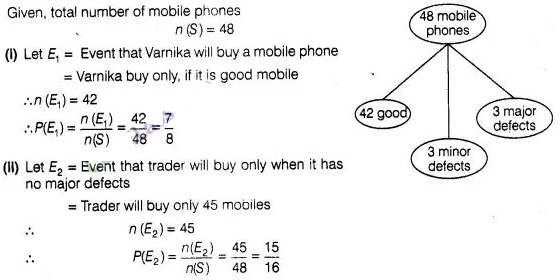
Question
41:
A bag contains 24 balls of which x are red, 2x are white
and 3x am are. A ball is selected at random. What is the probability that it
(i) not
red?
(ii) white
Solution:
Given that,
A bag contains total number of balls = 24 A bag contains number of red bails =
24
A bag contains number of white balls = 2x and a bag contains number of
blue balls = x
By
condition,
x + 2x + 3x = 24
⇒
6x = 24
∴
x = 4
∴Number of red balls = x = 4
Number of white balls = 2x = 2 x
4 = 8
and number of blue balls = 3x = 3 x 4 = 12
So, total number of
outcomes for a ball is selected at random in a bag contains 24 balls.
⇒
n(S) =
24
Question
42:
At a fete, cards bearing numbers 1 to 1000, one number on
one card, are put in a box. Each player selects one card at random and that card
is not replaced. If the selected card has a perfect square greater than 500, the
player wins a prize. What is the probability that
(i) the first player
wins a prize?
(ii) the second player wins a prize, if the first has
won?
Solution:
Given that,,
at a fete, cards bearing numbers 1 to 1000 one number on one card, are put in a
box. Each player selects one card at random and that card is not replaced so,
the total number of outcomes are n(S) = 1000
If the selected card has a
perfect square greater than 500, then player wins a prize.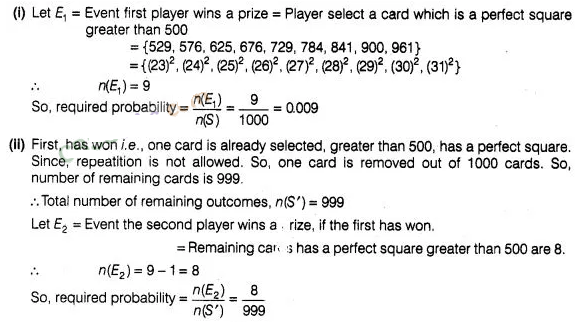
Exercise 13.4 Long Answer Type Questions
Question
1:
Find the mean marks of students for the following
distribution
Solution: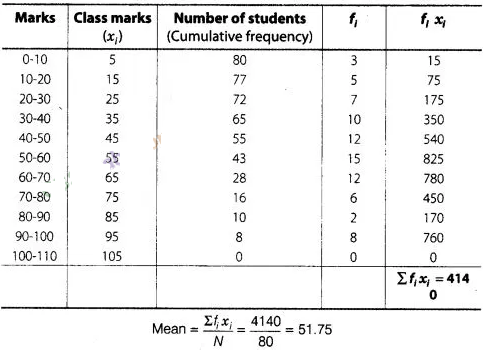
Question
2: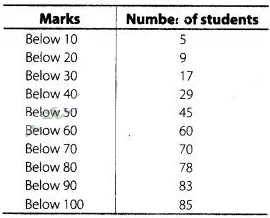
Solution:
Here,
we observe that, 5 students have scored marks below 10, i.e. it lies between
class interval 0-10 and 9 students have scored marks below 20,
So, (9 – 5) =
4 students lies in the class interval 10-20. Continuing in the same manner, we
get the complete frequency distribution table for given data.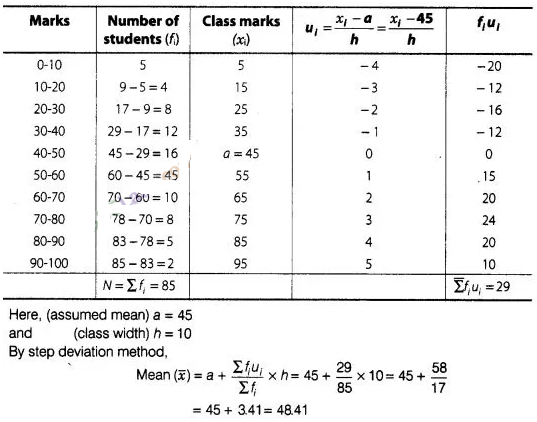
Question
3:
Find the mean age of 100 residents of a town from the
following data.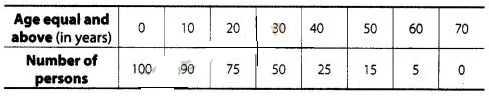
Solution:
Here,
we observe that, all 100 residents of a town have age equal and above 0. Since,
90 residents of a town have age equal and above 10.
So, 100 – 90 = 10
residents lies in the interval 0-10 and so on. Continue in this manner, we get
frequency of all class intervals. Now, we construct the frequency distribution
table.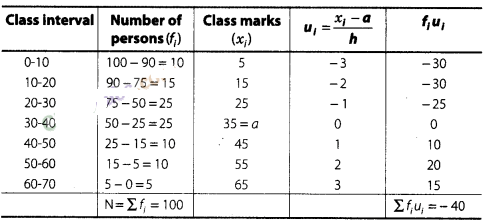
Question
4:
The weights of tea in 70 packets are shown in the
following table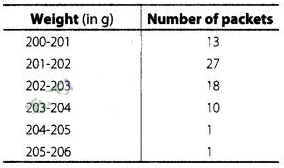
Find the mean weight of
packets.
Solution:
First,we
find the class marks of the given data as follows,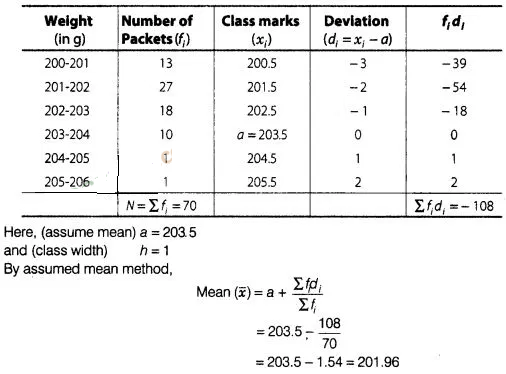
Hence, the required
mean weight is 201.96 g.
Question
5:
Refer to Q.4 above. Draw the less than type ogive for this
data and use it to find the median weight.
Solution:
We
observe that, the number of packets less than 200 is 0, Similarly, less than 201
include the number of packets from 0-200 as well as the number of packets from
200-201.
So, the total number of packets less than 201 is 0 + 13 = 13. We say
that, the cumulative frequency of the class 200-201 is 13. Similarly, for other
class.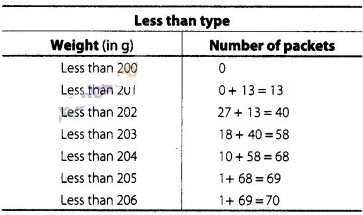
To draw the less than
type ogive, we plot the points (200, 0), (201, 13), (202, 40) (203, 58), (204,
68), (205, 69) and (206, 70) on the paper and join by free hand, v Total number
of packets (n) = 70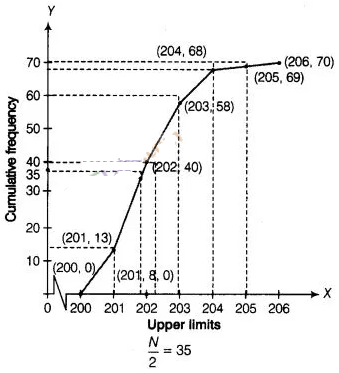
Firstly, we plot a
point (0, 35) on Y-axis and draw a line y = 35 parallel to X-axis. The line cuts
the less than ogive curve at a point. We draw a line on that point which is
perpendicular to X-axis. The foot of the line perpendicular to X-axis is the
required median.
Median weight = 201.8 g
Question
6:
Refer to Q.5 above. Draw the less than type and more than
type ogives for the data and use them to find the meadian weight.
Solution:
For less
than type table we follow the Q.5.
Here, we observe that, the weight of all
70 packets is more than or equal to 200. Since, 13 packets lie in the interval
200-201. So, the weight of 70 -13 = 57 packets is more than or equal to 201.
Continuing in this manner we will get remaining more than or equal to 202, 203,
204, 205 and 206.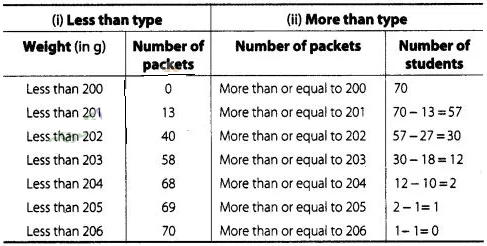
To draw the less than
type ogive, we plot the points (200, 0), (201,13), (202, 40), (203, 58), (204,
68), (205,69), (206, 70) on the paper and join them by free hand.
To draw the
more than type ogive plot the points (200, 70), (201, 57), (202, 30), (203, 12),
(204, 2), (205,1), (206, 0) on the the graph paper and join them by free
hand.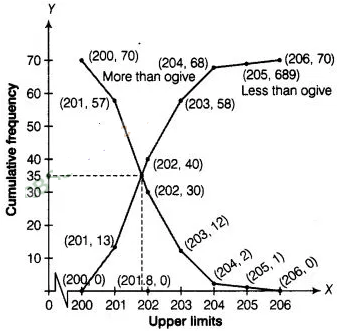
Hence,required median
weight = intersection point of x – axis = 201.8 g.
Question
7:
The table below shows the salaries of 280 persons.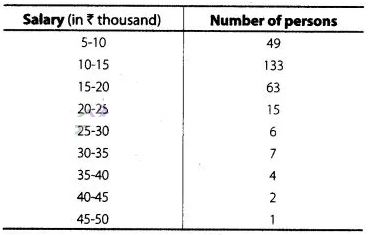
caluculate the median
and mode of the data.
Solution:
First, we
construct a cumulative frequency table.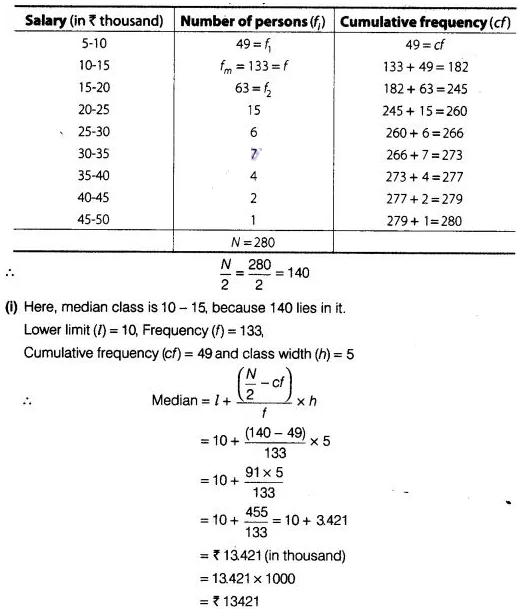
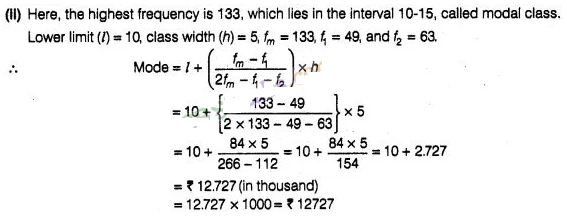
Hence,the median and
modal salary are ₹13421 and ₹12727,respetively.
Question
8:
The mean of the following frequency distribution is 50 but
the frequencies f1 and f2 in classes 20-40 and 60-80,
respectively are not known. Find these frequencies, if the sum of all the
frequencies is 120.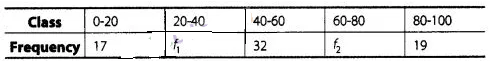
Solution:
First
we caluculate the class mark of given data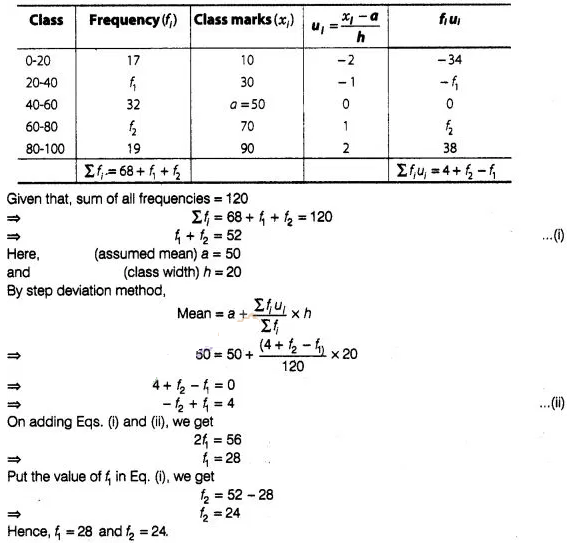
Question
9:
The median of the following data is 50. Find the values of
p and q, if the sum of all the frequencies is 90.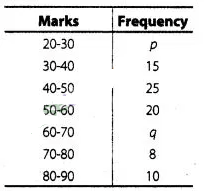
Solution:.
Question
10:
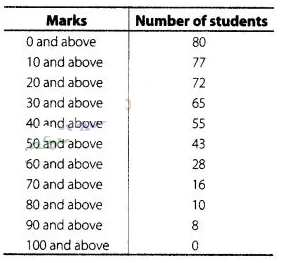
The distribution of heights (in cm) of 96 children is
given below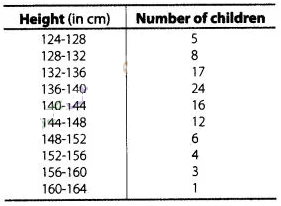
Draw a less than type
cumulative frequency curve for this data and use it to compute median height of
the children.
Solution: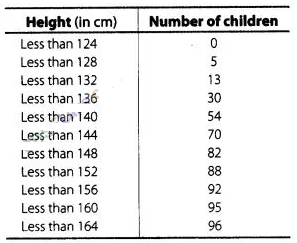
To draw the less than
type ogive, we plot the points (124, 0), (128, 5), (132, 13), (136, 30), (140,
54), (144, 70), (148, 82), (152, 88), (156, 92), (160, 95), (164, 96) and join
all these point by free hand.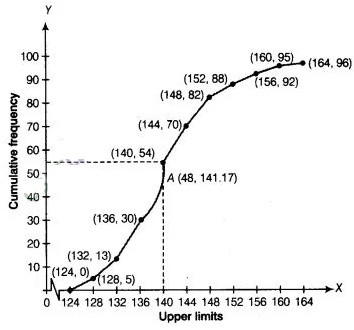
Here,
\(\frac{N}{2} =\frac{96}{2}\)
We take, y = 48 in Y-coordinate and draw a line
parallel to X-axis, meets the curve at A and draw a perpendicular line from
point A to the X-axis and this line meets the X-axis at the point which is the
median i.e., median = 141.17.
Question
11:
Size of agricultural holdings in a survey of 200 families
is given in the following
Compute median and mode size of the
holdings.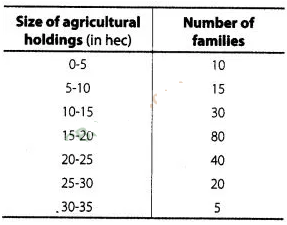
Solution: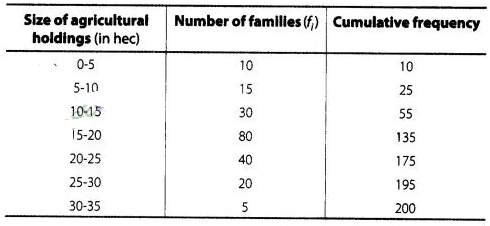
Question
12:
The annual rainful record of a city for 66 days is given
in the following table.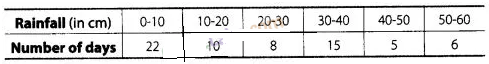
Calculate the median
rainfall using ogives (or move than type and of less than type)
Solution:
We
observe that, the annual rainfall record of a city less than 0 is 0. Similarly,
less than 10 include the annual rainfall record of a city from 0 as well as the
annual rainfall record of a city from 0-10.v
So, the total annual
rainfall record of a city for less than 10 cm is 0+ 22 =22 days. Continuing in
this manner, we will get remaining less than 20, 30, 40, 50, and 60.
Also, we
observe that annual rainfall record of a city for 66 days is more than or equal
to 0 cm. Since, 22
days lies in the interval 0-10. So, annual rainfall record
for 66-22 = 44days is more than or equal to 10 cm.
Continuing in this manner
we will get remaining more than or equal to 20, 30, 40, 50 and 60.
Now, we
construct a table for less than and more than type.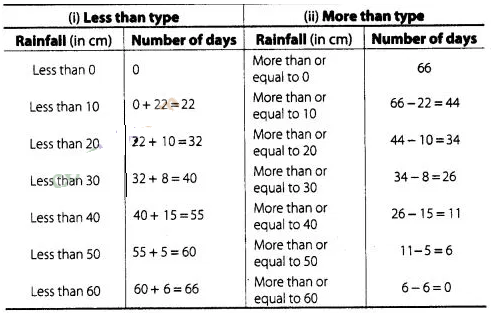
To draw less than type
ogive we plot the points (0, 0), (10, 22), (20, 32), (30, 40), (40, 55), (50,
60), (60, 66) on the paper and join them by free hand.
To
draw the more than type ogive we plot the points (0, 66), (10, 44), (20, 34),
(30, 26), (40, 11), (50, 6) and (60, 0) on the graph paper and join them by free
hand,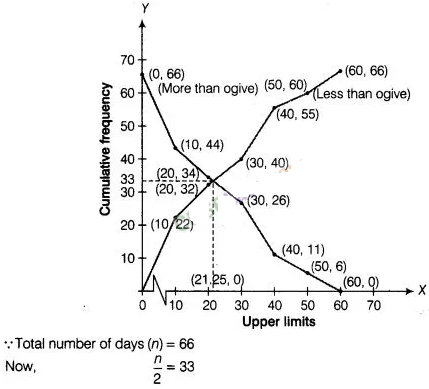
Firstly, we plot a line
parallel to X-axis at intersection point of both ogives, which further intersect
at (0, 33) on Y-axis. Now, we draw a line perpendicular to X-axis at
intersection point of both ogives, which further intersect at (21.25, 0) on
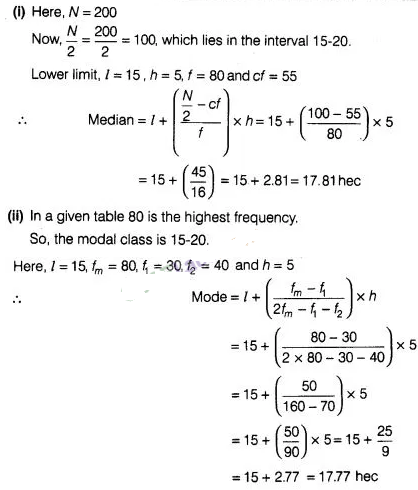
X-axis. Which is the required median using ogives.
Hence, median rainfall =
21.25 cm.
Question
13:
The following is the frequency distribution of duration
for 100 calls made on a mobile phone.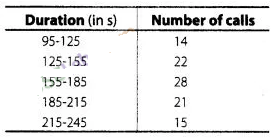
Solution:
First,
we calculate class marks as follows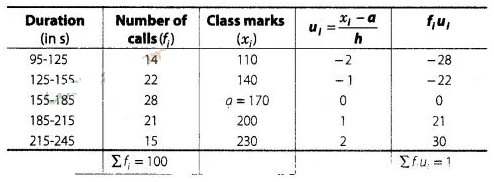
Here, (assumed mean) a
= 170,
and (class width) h = 30
By step deviation method,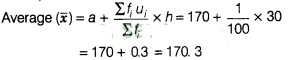
Hence, average duration
is 170.3s.
For calculating median from a cumulative frequency
curve
We prepare less than type or more than type ogive
We
observe that, number of calls in less than 95 s is 0. Similarly, in less than
125 s include the number of calls in less than 95 s as well as the number of
calls from 95-125.s So, the total number of calls less than 125 s is 0 + 14 =
14. Continuing in this manner, we will get remaining in less than 155,185, 215
and 245 s.
Now, we construct a table for less than ogive (cumulative
frequency curve).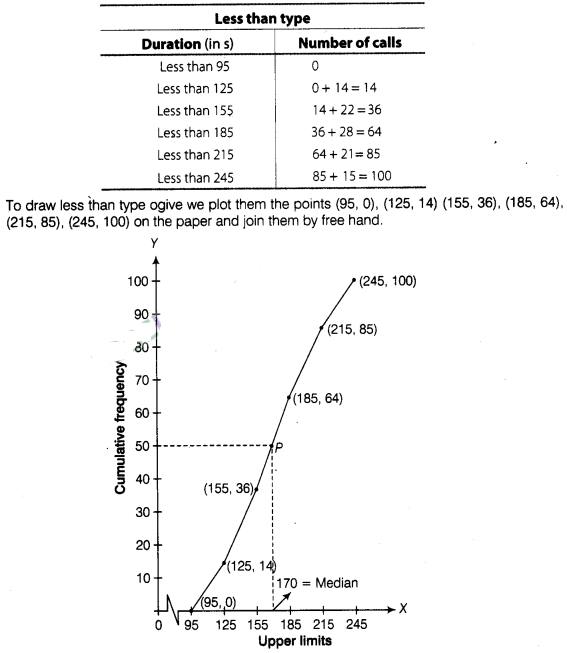
Now, point 50 taking on
Y-axis draw a line parallel to X-axis meet at a point P and draw a perpendicular
line from P to the X-axis, the intersection point of X-axis is the median.
Hence, required median is 170 .
Question
14:
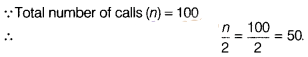
50 students enter for a school javelin throw competition.
The distance (in metre) thrown are recorded below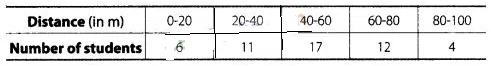
(i)
Construct a cumulative frequency table.
(ii) Draw a cumulative
frequency curve (less than type) and calculate the median distance drawn by
using
this curve.
(iii) Calculate the median distance by using the formula
for median.
(iv) Are the median distance calculated in (ii) and (iii)
same?
Solution: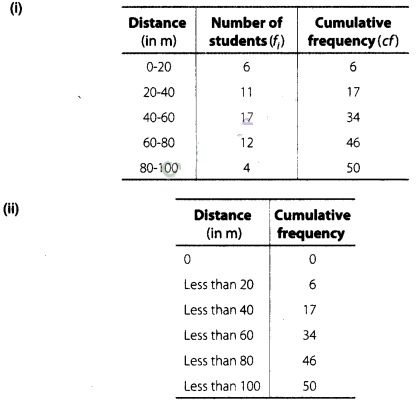
To draw less than type
ogive, we plot the points (0, 0), (20, 6), (40,17), (60, 34), (80, 46), (100,
50), join all these points by free hand.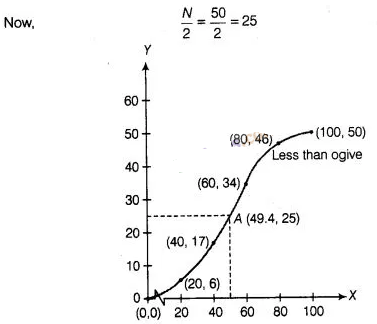
Taking Y = 25 on y-axis
and draw a line parallel to X-axis, which meets the curve at point A From point
A we draw a line perpendicular to X-axis, where this meets that point is the
required median i.e., 49.4.
(lv) Yes, median
distance calculated by parts (ii) and (iii) are same.